
Image source: https://github.com/YueErro/pandas
Pandas, the ultimate weapon for every data enthusiast. This powerful library in Python makes data manipulation and exploration effortless and enjoyable. The intuitive syntax and wide range of functions turn raw data into valuable insights that are vital for anyone working with data. Pandas, you make us complete in our data journey.
< — — — — — — — — — — — — — — — <**>— — — — — — — — — — — — — — — —>
In this Article, we’ll take a look at some of the 20 Advanced functions in pandas by using a popular dataset called “Palmer Penguins” and provide examples of how to use them.
1. apply()
This function is used to apply a function to each element or row/column of a DataFrame or Series.
import pandas as pd
penguins_df = pd.read_csv("penguins.csv") # read_csv is also a function to read csv file
penguins_df["bill_length_mm"] = penguins_df["bill_length_mm"].apply(lambda x: x/10)

2. nunique()
This function is used to count the number of unique values in a column of a DataFrame.
penguins_df["species"].nunique()
In this output we have only 3 unique species
3. sort_values()
This function is used to sort a DataFrame by one or more columns in ascending or descending order.
penguins_df.sort_values("body_mass_g", ascending=False)

4. rename()
This function is used to change the column names of a DataFrame.
penguins_df = penguins_df.rename(columns={"species":"penguin_species"})

5 . groupby()
This function is used to group data in a DataFrame by one or more columns, and then perform calculations on the grouped data. This is a powerful function that is often used for data aggregation and analysis.
grouped_df = penguins_df.groupby("species").mean()
grouped_df # groups data by species and calculate the mean for each group

6. query()
This function is used to filter rows of a DataFrame based on a query string.
Adelie_penguins = penguins_df.query('species == "Adelie"')

7. melt()
melted_df = penguins_df.melt(id_vars=["species"], value_vars=["bill_length_mm", "bill_depth_mm"])
melted_df

8. crosstab()
This function is used to create a cross-tabulation of two or more columns in a DataFrame. It’s useful for analyzing the relationship between two categorical variables.
crosstab = pd.crosstab(penguins_df['species'], penguins_df['sex'])
crosstab

9. pivot_table()
This function is used to create a pivot table from a DataFrame. A pivot table is a summary of data grouped by one or more columns, and it’s useful for data exploration and analysis.
pivot_df = penguins_df.pivot_table(index='species', columns='sex', values='bill_length_mm', aggfunc='mean')
pivot_df # create a pivot table with the mean of bill_length_mm grouped by species and sex

10. iloc() and loc()
These functions are used to select rows and columns from a DataFrame by index or label. The iloc function is used to select rows and columns by integer-based indexing, while the loc function is used to select rows and columns by label-based indexing.
penguins_df.iloc[0, 0] # selects the first element in the first row
penguins_df.loc[0, "species"] # selects the element in the first row and species column
Both iloc() and loc() output is “Adelie”.
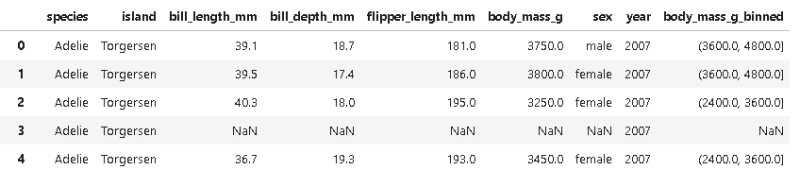
11. cut()
This function is used to bin continuous data into discrete intervals, it’s useful for data exploration and visualization.
penguins_df['body_mass_g_binned'] = pd.cut(penguins_df['body_mass_g'], bins=np.linspace(0, 6000, num=6))
12. isin()
This function is used to filter DataFrame by matching the values against a list of values.
species_list = ['Adelie', 'Chinstrap']
penguins_df = penguins_df[penguins_df['species'].isin(species_list)]

13. value_counts()
This function is used to count the number of occurrences of each unique value in a column of a DataFrame.
species_count = penguins_df['species'].value_counts()

14. drop()
This function is used to drop one or more columns or rows from a DataFrame.
penguins_df = penguins_df.drop("species", axis=1)

15 . rolling()
This function is used to create a rolling window of a certain size on a DataFrame or Series, allowing for the calculation of a statistic for each window.
penguins_df["rolling_mean_bill_length"] = penguins_df["bill_length_mm"].rolling(window=3).mean()

These are some of the most Advanced used functions in pandas and examples of how to use them. These functions are powerful tools for data manipulation and analysis. These Function always used by Data Scientist , Data Analysts and many Data Geeks.


Top comments (0)