Hi there 👋, We will see how to launch Grafana cloud from AWS in an easy way, with no installation etc. Cool thing is it comes with a free trial 😎 which should help us play on Grafana and learn about it's various visualization styles. In this post, we won't be building any graphs, to start with, we would just see a basic panel type which would help us creating links to other dashboards.
Marketplace
Let's see how to launch Grafana from AWS Marketplace.

Goto market place and click on discover products.

Search for grafana cloud and click on the appropriate link.

There is a free trial option, so I am clicking on Try for Free and Create Contract in the next step.
Clicking on Setup your Account would redirect to Grafana cloud URL where we can signup or link an existing account and create an organization. I have linked my existing account and chosen an existing organization.
Alright, we are all set to get started. You should be on the grafana organization URL with this format https://grafana.com/orgs/<organization-name>. On this page, click Add Stack to add your first stack.

You can choose an instance URL and region for your stack. It should take a few minutes for the stack to launch. Your stack should have an instance URL in this format https://<instance-name>.grafana.net. You may sign in to this instance to see a page like this:
Folder
Let's go to Home > Dashboards and create new folder with name dummy-folder.

Inside this folder I am going to create a new dashboard.

Goto settings name it dummy-dashboard-1 and give it a tag kubernetes.

Then, save the dashboard.
Go back to the folder and create other dashboards similarly so that you have the following dashboards with tags kubernetes, kafka and sql:

Dashboard list
Goto Home > Dashboards and Create a new dashboard. Close the datasource selection window and click Add a visualization. Choose Dashboard List as the visualization type on the top right corner.

Give the panel a title such as dashboard-list-all.

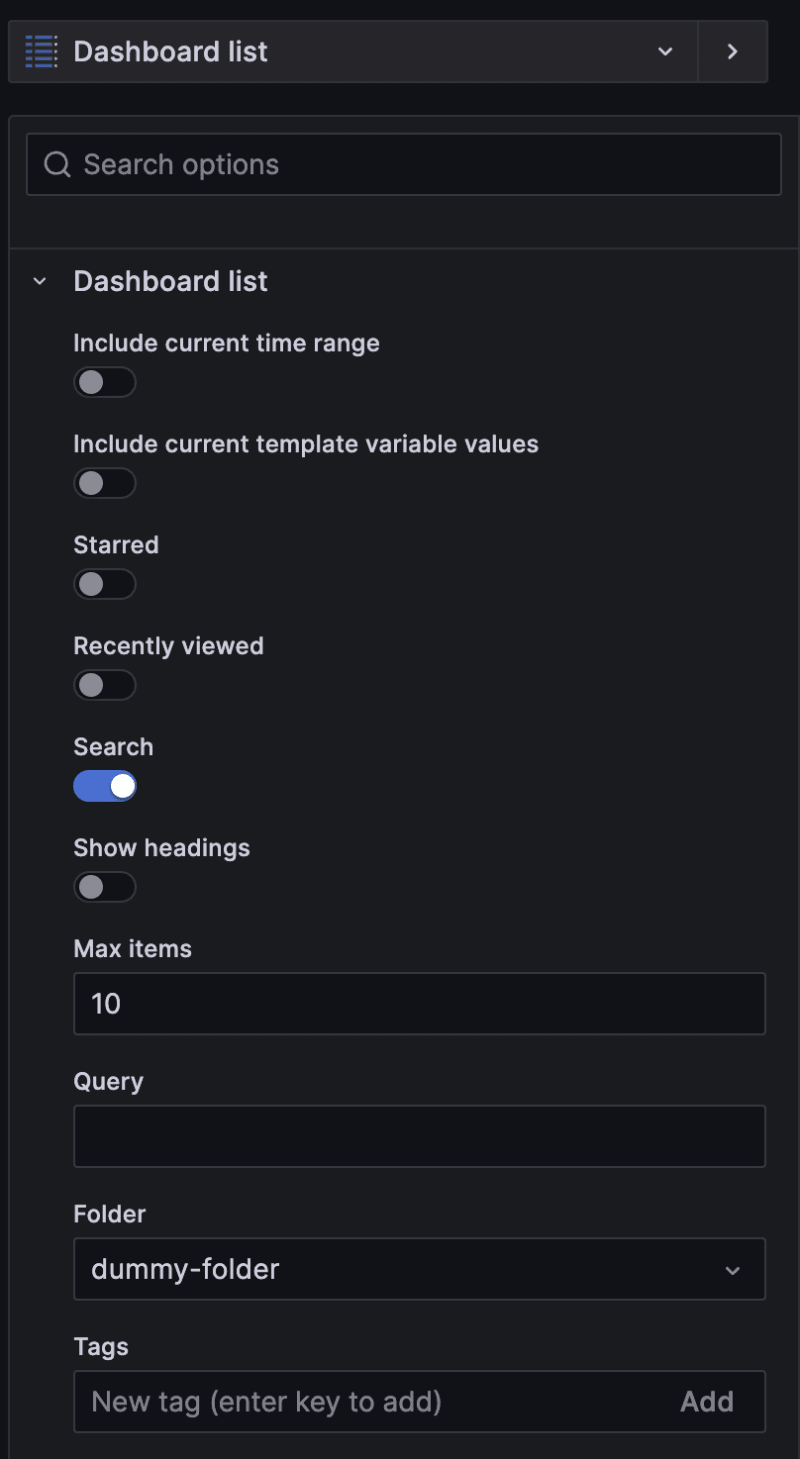
Scroll down, enable the search option, choose the folder as dummy-folder and leave the tags option empty like below.

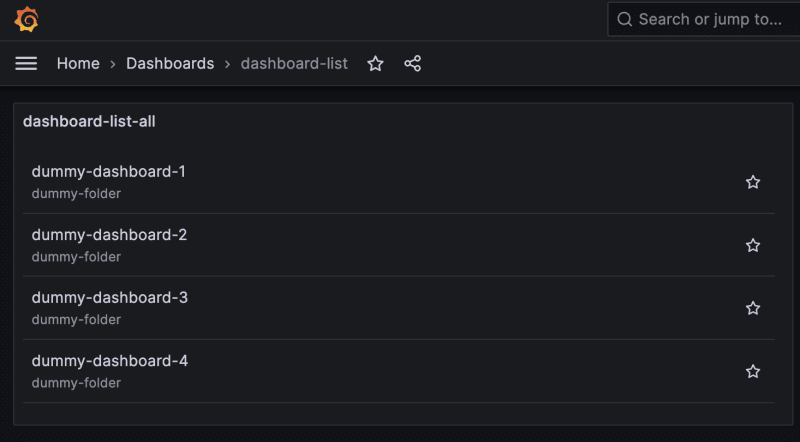
On the preview window on the left, it should show all the dashboards in the dummy-folder.

Save the panel, and save the dashboard with the name dashboard-list. You should see something like this:

Click on the three dots on the panel, and duplicate the panel by clicking on the appropriate option like shown below.

Click on the three dots on the new panel, and edit it.

Give this new panel, the title dashboard-list-kubernetes and add a tag kubernetes.

Easy enough, the preview should now only show dashboards that are tagged with kubernetes, i.e. dashboards 1 to 3.

Save the panel and repeat the steps for kafka and sql. So, finally you should see something like below.

About tags
One thing to note, the tags we add in the panel are searched with AND condition. Meaning you will not see any dashboards if you added multiple tags like kubernetes, kafka, sql. Because, each of our dashboards had only one tag. For this purpose let's add a 10th dashboard with all 3 tags inside the dummy-folder.

And edit the dashboard-list-all panel to search for these 3 tags.

The dashboard should now look like this.

Summary
So we have to seen how to launch Grafana cloud from AWS as a subscription, with free trial. Built some dummy dashboards on Grafana cloud and saw how to build panels with visualization type Dashboard list with the search folder and tags option, and played a bit with the tags.


Top comments (0)