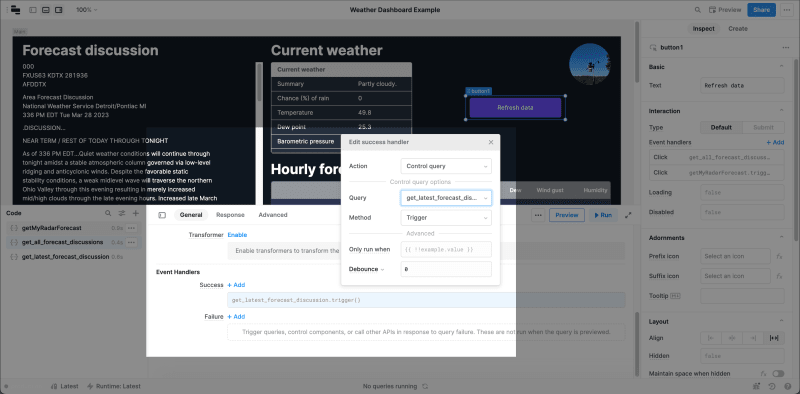
Retool is great for building business software but I love to use it for personal/side projects as well. With just a few API calls, you can use it to build your own weather dashboard.
What you'll build
You're going to create a weather dashboard that shows the forecast and the National Weather Service (NWS) forecast discussion. The combination of standard forecast data (highs, lows, etc.) and text discussion from meteorologists makes for a well-rounded forecast.
The forecast data is provided by MyRadar, and the NWS discussion comes from the NWS API. Both the MyRadar and NWS APIs are free to use with some standard limitations.
Prerequisites
To build the weather dashboard, you'll need:
- A Retool account.
- A MyRadar dev account. Make sure to note down your Subscription Key.
You can find these later but if you want to have everything up front, you also need:
- The lat/long of the location you want a forecast for. You can use Google Maps to search for the location, then right click the pin and it'll show the lat/long. This guide uses Detroit so you can use
42.34899378680771, -83.07695478794027if you want. - An NWS forecast office code. This guide is going to use Detroit's code (
dtx) but if you want to find the office closest to you, click the location on this map. It opens a new page and the code is in the URL (Detroit's NWS office URL:https://www.weather.gov/dtx/).
1. Create a MyRadar resource
Resources are how you connect your data sources to Retool.
- Navigate to
/resourcesin Retool and click Create new -> Resource. - Select Rest API.
- Fill out the resource configuration page like this:

- Click Create resource -> and then Create an app ->. This opens another modal where you name the app and then click Create app.
2. Retrieve forecast data
If you don't have a lat/long yet, see the prereqs section.
To retrieve forecast data:
- Click on query1 and rename it to getMyRadarForecast.
- Pass the lat/long (
42.34899378680771,-83.07695478794027) in the endpoint:
- Then in the URL parameters section, set
unitstous.
- Click Save and run.
3. Display forecast data
The data returned is split up into timeframes (currently, minutely, hourly, and daily). This app is going to show the current weather and the hourly forecast, but feel free to display what you want.
To display the current weather:
- Drag a Key Value component to the canvas and set its Data property to
{{getMyRadarForecast.data.currently}}. - In the Inspect tab on the right, hover over the Rows you want to hide and click the eyeball icon.
- Optionally edit the Title of the key column and the individual Column titles.

To display the hourly forecast:
- Drag a Table component to the canvas and set its Data property to
{{ getMyRadarForecast.data.hourly.data }}. - Similar to the current weather, click the eyeball icon to show/hide columns.
- Optionally edit the Column titles by selecting the column and editing the Column title value.
- Convert the UNIX timestamp in the time column by selecting the column in the Inspect tab, and then setting Mapped value to
{{moment.unix(self).format("MM/DD/YYYY h:mm:ss A")}}.
4. Retrieve forecast discussion
If you don't have an NWS forecast office code yet, see the prereqs section. You can also use the one in the examples below (dtx) if you don't want to use your local office.
Create a new resource query and set the:
- Resource to RESTQuery (restapi).
- endpoint to
https://api.weather.gov/products/types/AFD/locations/DTX(if you're using your local office, replaceDTXwith your local office code).
Click Save and run and rename the query to get_all_forecast_discussions.
This query retrieves URLs for every available forecast discussion for the office. To retrieve the latest discussion:
- Duplicate the query you just created.
- Set the endpoint to
{{get_all_forecast_discussions.data['@graph']['0']['@id']}}. - Name the query
get_latest_forecast_discussion. - Click Save and run

5. Display the forecast discussion
To display the forecast discussion:
- Drag a Text component to the canvas and set its value to
{{get_latest_forecast_discussion.data.productText}}. - Forecast discussions can be long sometimes, so set the Height to fixed on the Text component.

6. Optional polish
You now have all your weather data in the app, but if you want to polish things up a bit:
- Use Text components to add headers to each part of the app.
- Rearrange the components so they fit together well.
- Customize the style.
- Add a Button component to refresh the data.
To add a refresh button:
- Drag a Button component to the canvas.
- Add two event handlers that trigger the
getMyRadarForecastandget_all_forecast_discussionsqueries.
- Select the
get_all_forecast_discussionsquery and create an event handler that runsget_latest_forecast_discussion. This way when the button is clicked, the latest forecast discussion is refreshed.
The finished product
If you want the JSON for this app so you can import it to create your own version, here's the gist.


Top comments (0)