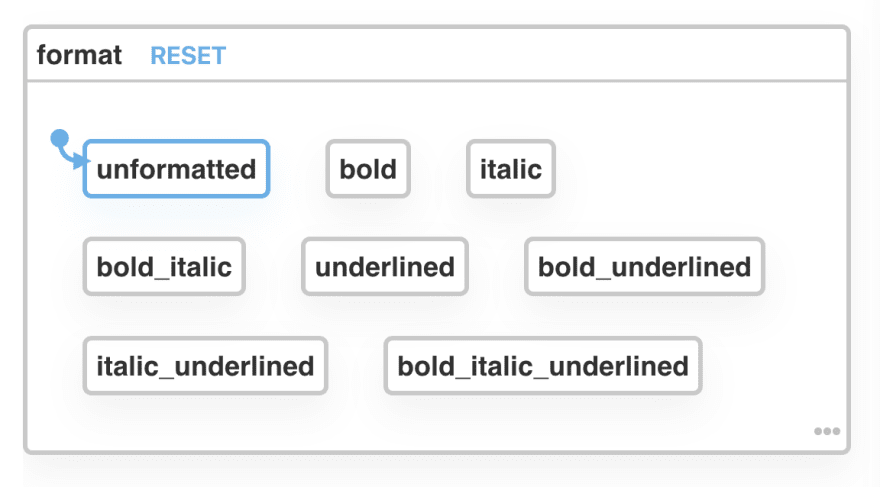
The number of states in a system can grow rapidly as features are added, and without proper state management it can get unwieldy quickly. Consider a word processor. They offer three distinct ways to format text.
- Bold
- Italic
- Underlined
Each of these buttons can be toggled on or off, independently of any other. Since each button has 2 states, and there are 3 buttons, that gives us 2^3 = 8 permutations of these three variables
Kyle Shevlin created a fun site to help demonstrate how quickly these can get out of hand here at Heard You Like Booleans
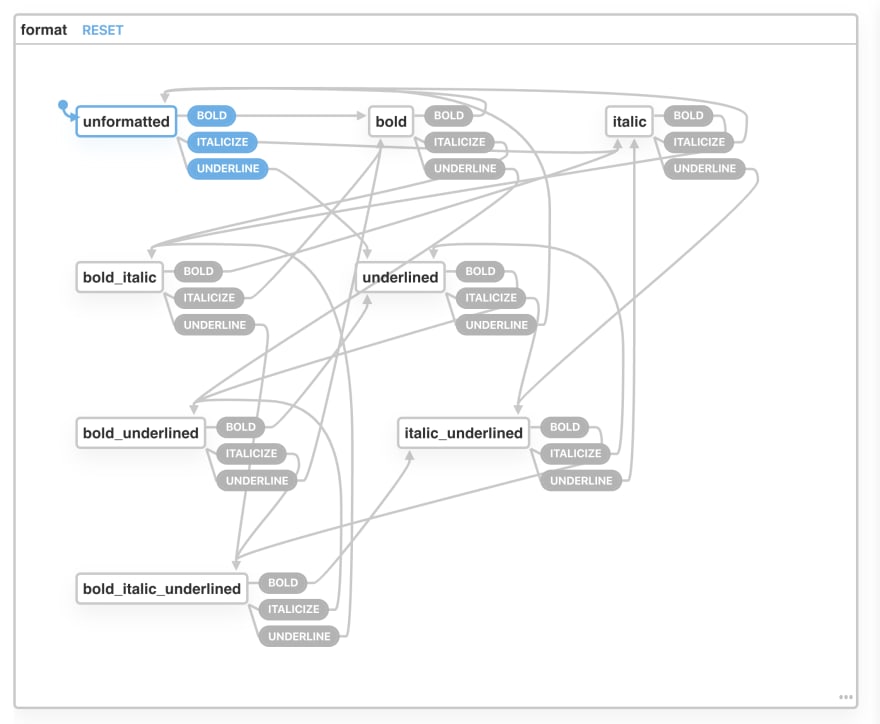
When the user toggles the bold button, we want that to move from either a non-bold state to a bold state, or the reverse. We can model this with a BOLD action that transitions from unformatted to bold and vice versa.
The same pattern can be applied to the italic and underlined states, as well as every permutation thereof.
To try it out, you can walk through the machine here with the XState Visualizer
https://xstate.js.org/viz/?gist=287ae37cfc1db9c5c098ea3ae4057a60
Modelled this way, the complexity of such a simple set of states is very clear, and this represents one of the shortcomings of both finite state machines and classic boolean state handling. What happens when we want to extend this? A user of our word processor should be able to align text to the left, right, centered, or justified. We'd end up with 32 distinct, finite states.
State Charts are an extension of the finite state machine, allowing us to store extended state within the diagram.
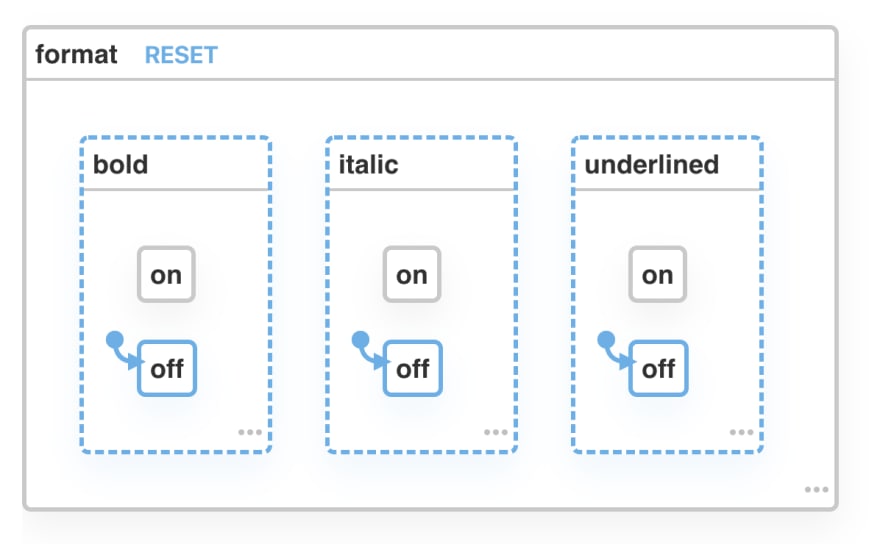
Looking back at our model, we have 3 independent toggle buttons. While changing one affects the final state we end up in, it does not affect the state of either of the two other buttons. State charts give us the opportunity to model them independently with parallel states.
Parallel states differ from classic states in that the machine is in every state at once. The default state is simultaneously format.bold.off, format.italic.off, and format.underlined.off
The simplicity of this approach is even more apparent once we add the transitions between states
Example: https://xstate.js.org/viz/?gist=b9a8e4db654cea07fe2080bd56b6cdc7
The next part of this series is here at XState Text Formatting Part 2
References
Constructing the user interface with state charts (Addison Wesley, 1999)


Top comments (0)