Disclosure: I came out with the content, database setup, and queries. But I use ChatGPT and perplexity to fix the grammar, tone, and spelling.
So you discovered an application running slow. You suspect that the application is running a slow database query. How do you find out?
One way is to use pg_stat_statements. The pg_stat_statements tool collect all queries and their performance metrics. It allows you to identify the slowest query, but it does not show why they are slow. This is where the EXPLAIN comes in, complementing pg_stat_statements in your investigation.
The SQL EXPLAIN query is a way for you view the execution plan of your query. It provides information that will help you make changes to improve performance. EXPLAIN query is not an SQL standard, but many database engines supports it. Since I primarily use PostgreSQL— and different engines output information in various formats — I will focus solely on PostgreSQL’s implementation.
There are several forms of the EXPLAIN command that I use. While there are additional variations available that you might find useful, the following are the ones I typically rely on:
Key differences
-
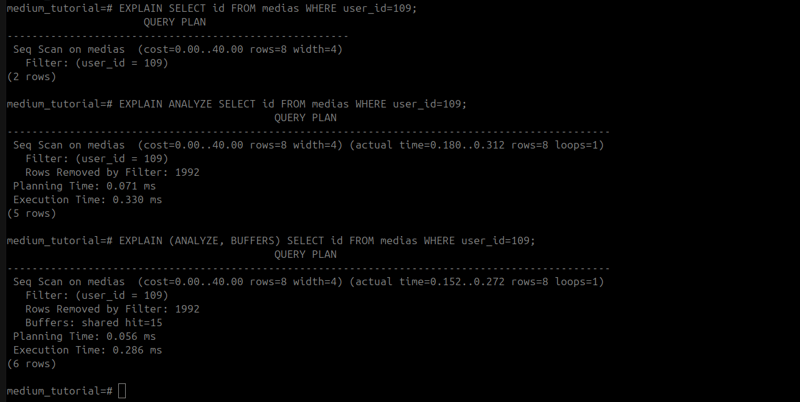
EXPLAIN $query: Display the query plan without executing query -
EXPLAIN ANALYZE $query: Executes the query and returns the query plan along with the execution time. Note that if you use this with UPDATE, DELETE, or INSERT statements, it will modify your data. -
EXPLAIN (ANALYZE, BUFFERS) $query: Performs the same as EXPLAIN ANALYZE but additionally provides information on shared buffers. Let’s start with an example database I have created:-

There is around 200 users, and 2000 medias.
My go-to query is the EXPLAIN (ANALYZE, BUFFERS) command. Below is an example session:
medium_tutorial=# EXPLAIN (ANALYZE, BUFFERS) SELECT id FROM medias WHERE user_id=109;
                                          QUERY PLAN
-------------------------------------------------------------------------------------------------
Seq Scan on medias  (cost=0.00..40.00 rows=8 width=4) (actual time=0.150..0.270 rows=8 loops=1)
  Filter: (user_id = 109)
  Rows Removed by Filter: 1992
  Buffers: shared hit=15
Planning Time: 0.063 ms
Execution Time: 0.285 ms
(6 rows)
Let’s parse the output:
-
Seq Scan on mediasThis indicates that the query is performing a sequential scan on the medias table—meaning it is not using an index. (I will show an example of an index search later.) -
(cost=0.00..40.00 rows=8 width=4)The query planner estimates an initial cost of 0.00 and a final cost of 40.00. It also estimates that the query will return 8 rows, with each row being 4 bytes wide. These cost metrics help the planner decide on the most optimal execution plan. -
(actual time=0.150..0.270 rows=8 width=4)This shows the actual time taken to execute the query. In this case, the execution started at 0.150 ms and ended at 0.270 ms. -
Rows Removed by Filter: 1992This indicates that 1992 rows were scanned and then discarded based on the filter condition. A high number of rows being filtered out may impact performance. -
Buffers: shared hit=15This shows that 15 blocks of data were retrieved from the shared buffer cache. (In PostgreSQL, each block is typically 8KB.) -
Execution Time: 0.285 msThe total time taken to execute the query was 0.285 ms.
Now let’s add an index in the medias table.
CREATE INDEX medias_user_id_idx ON medias(user_id);
Now rerun the query:
medium_tutorial=# EXPLAIN (ANALYZE, BUFFERS) SELECT id FROM medias WHERE user_id=109;
                                                       QUERY PLAN
---------------------------------------------------------------------------------------------------------------------------
Bitmap Heap Scan on medias  (cost=4.34..18.09 rows=8 width=4) (actual time=0.057..0.065 rows=8 loops=1)
  Recheck Cond: (user_id = 109)
  Heap Blocks: exact=5
  Buffers: shared hit=5 read=2
  ->  Bitmap Index Scan on medias_user_id_idx  (cost=0.00..4.34 rows=8 width=0) (actual time=0.046..0.046 rows=8 loops=1)
        Index Cond: (user_id = 109)
        Buffers: shared read=2
Planning:
  Buffers: shared hit=10 read=1
Planning Time: 0.782 ms
Execution Time: 0.082 ms
(11 rows)
Now, there are a couple of differences:
-
Bitmap Heap Scan on MediaThis indicates that the query is now using the index. -
Buffers: shared hit=5 read=2The new metric, read, shows the number of blocks read from disk (each block is typically 8KB, so 2 blocks equal 16KB). These blocks are then stored in the cache. - Time Breakdown: The output now provides a more detailed breakdown of the execution time, including both planning and execution phases.
- Faster Execution Time: Finally, note that the overall execution time is faster after adding the index!
Finally, you can also use EXPLAIN to test your assumptions. Here are a couple of reasons why it's important to do so:
- Unexpected Query Plans: The query planner might not produce the query plan you expect, choosing instead a plan that it deems more cost-effective.
- ORM-Generated Queries: Your ORM may generate queries that are not optimal. For example, it might generate a SELECT * query—even when you only need a few columns—which can be inefficient if the table has many columns.
Consider a concrete example. One might assume that a query like selecting id from users would simply use the index on medias.
However, the actual plan shows that a join is performed instead:
medium_tutorial=# EXPLAIN (ANALYZE, BUFFERS) SELECT id FROM medias WHERE user_id in (SELECT id FROM users limit 100);
                                                    QUERY PLAN
---------------------------------------------------------------------------------------------------------------------
Hash Semi Join  (cost=3.25..54.62 rows=1000 width=4) (actual time=0.093..1.102 rows=1000 loops=1)
  Hash Cond: (medias.user_id = users.id)
  Buffers: shared hit=17
  ->  Seq Scan on medias  (cost=0.00..35.00 rows=2000 width=8) (actual time=0.009..0.345 rows=2000 loops=1)
        Buffers: shared hit=15
  ->  Hash  (cost=2.00..2.00 rows=100 width=4) (actual time=0.065..0.066 rows=100 loops=1)
        Buckets: 1024  Batches: 1  Memory Usage: 12kB
        Buffers: shared hit=2
        ->  Limit  (cost=0.00..2.00 rows=100 width=4) (actual time=0.009..0.042 rows=100 loops=1)
              Buffers: shared hit=2
              ->  Seq Scan on users  (cost=0.00..4.00 rows=200 width=4) (actual time=0.008..0.025 rows=100 loops=1)
                    Buffers: shared hit=2
Planning:
  Buffers: shared hit=14 read=1
Planning Time: 0.397 ms
Execution Time: 1.207 ms
(16 rows)
In this case, the plan reveals that the query uses a join rather than simply scanning the index on medias. This unexpected join is a perfect example of why it's essential to test your assumptions with EXPLAIN before finalizing query optimizations.
In conclusion, if you suspect that a query is running slowly, start by checking it with pg_stat_statements and then use EXPLAIN to dive deeper into its execution plan. These tools are essential for validating your assumptions and gaining a clear understanding of your database's behavior—especially in complex systems where subtle differences in execution can significantly impact performance.


Top comments (0)