Vinted is growing – fast. To keep up with this increase in use, its Elasticsearch infrastructure constantly needs to be tuned. However, the most important requirement for any Elasticsearch performance tuning is to benchmark its production-like data. To collect this data, we’ve built a query logging solution that records Elasticsearch search requests at HTTP level and stores them to, well, Elasticsearch! Having a detailed query log not only allows us to tune the performance with the proper data, but it also allows us deeper visibility of our query traffic, which in turn means we can even perform speculative experiments.
Big Picture
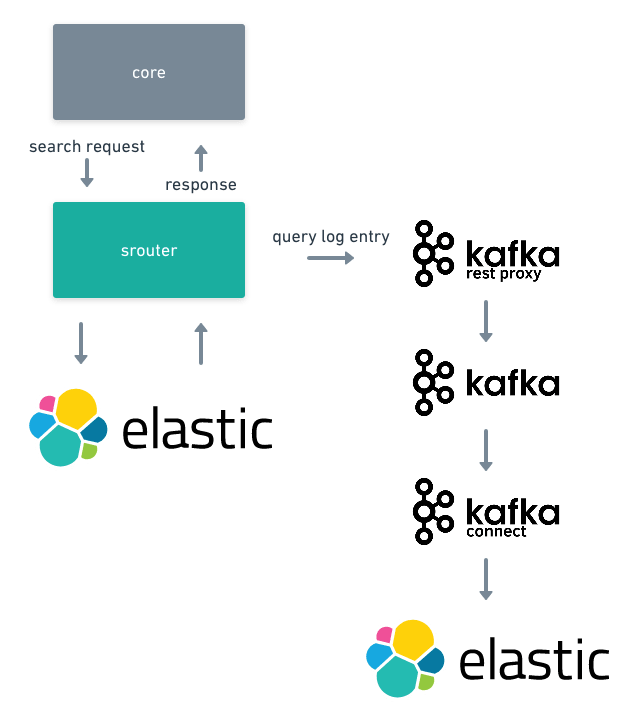
The query log is a data pipeline. Its high-level architecture can be visualised as follows:

As seen in the diagram, the search request is constructed by the core application before being sent to srouter.
Srouter then routes the search request to the required Elasticsearch cluster.
When this response comes back, srouter combines the search request with the response from Elasticsearch into the query log entry, and asynchronously sends it to the Kafka cluster through the Confluent Kafka REST Proxy1.
Kafka Connect2 then moves data from Apache Kafka to Elasticsearch.
The Elasticsearch cluster we use for query logs is the same Vinted-wide logging cluster described here.
Kibana is used to query and visualise the query log.
To summarise: the query log is not an innovation in itself. It’s a data pipeline built with and on top of the scalable components already in use.
Why a custom query logging pipeline?
At first, we were using the queries collected from the Elasticsearch Slow Log.
However, the Slow Log has several limitations:
- All recorded queries are slow by some definition of slow
- Stored queries are rewritten by Elasticsearch
- No way to identify
_countqueries - It collects all the queries that come to the cluster
- Recording various queries (e.g. queries slower than 1ms) might create a measurable impact on the Elasticsearch cluster (+5-7% I/O footprint on data nodes), which in turn might increase the amount of the slow queries3
- Infrastructure is needed to collect the logs from the Elasticsearch cluster nodes (additional load on the cluster nodes)
- Failed queries (e.g. timed-out) are stored in other logs
- The URL endpoint of the search request is not included
- The slow log is recorded at the shard level, meaning that the execution of a search request was within a specific shard of the cluster. This has to be kept in mind when interpreting slow queries (hint: hot-node problem). There is no data that might explain why the request ended in that shard, because the routing parameter is not recorded
-
statsis missing - Etc.
With these limitations in mind, we drafted the requirements for a new query log pipeline:
- Combine search request and response and store them verbatim
- Capture a random portion of the query traffic (e.g. 1%)
- Capture all failed requests (e.g. timed-out)
- Expose a parameter for the forced logging (e.g. record all queries of a small scale AB test)
- Query logs should be stored in the Elasticsearch cluster, because of how well we know Elasticsearch
The outcome of the new query log pipeline is somewhat similar to what we had with the Slow Log:
search requests stored in an Elasticsearch index.
However, having the search requests combined with responses and recorded at the HTTP level proved to be much easier to work with than with the Slow Log records.
Also, having the full details of the search request in the Elasticsearch index allows us to be very selective when using the data.
What exactly is in the query log entry?
The high-level structure of a query log entry is simply:
{
  "request_headers": {},
  "request_uri": "",
  "request_body": "",
  "response_status_code": "",
  "response_headers": {},
  "response_body": "",
  "extracted_data": {}
}
The interesting bit is the extracted_data.
We extract data such as:
- What was the
sizeandoffsetspecified in therequest_body - How much time it took for Elasticsearch to execute the query
response_body.took - How many hits the query had
- What were the target index, routing parameter, and timeout settings are extracted from the
request_uri - Extract
search_session_idfrom the HTTPrequest_headers - Extract deprecation warnings from the Elasticsearch
response_headers - Etc.
The data extraction is done using the Elasticsearch Ingest Pipelines.
The query log index configuration is done with Elasticsearch Index Management.
Use-cases
In this section, we present several non-obvious use cases of the query log at Vinted.
What do we mean by obvious?
By ‘obvious’, we mean something as simple as a plain old Kibana dashboard – which would be too uninteresting for the readers of this blog.
Performance tuning
We tune Elasticsearch performance primarily in these ways:
- Elasticsearch cluster settings, e.g. Elasticsearch version upgrade
- Tune index settings, e.g. field mapping types
- Tune search queries, e.g. which fields to query
- Functionaly decomposing indices
For faster iterations, we try to do as much of the work offline as possible, and for the first three experimentation types, the query log is the tool that enables offline iteration.
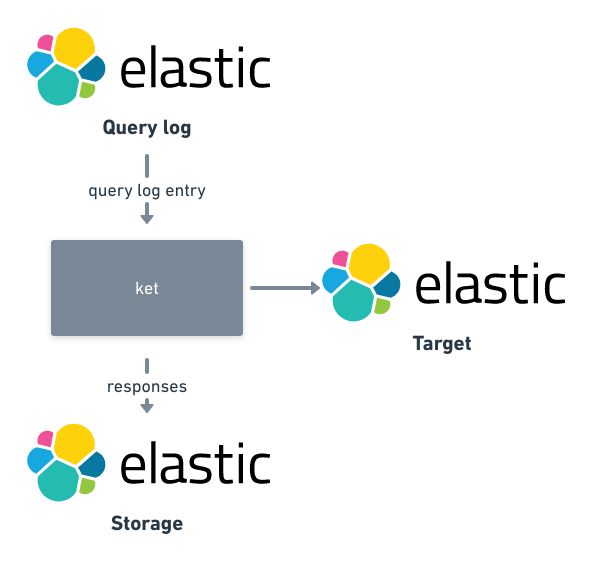
The base workflow of such experiments is visualised in the diagram below:
As seen in the diagram, query log replays are done mostly with ket4, our open-source tool.
ket knows how to query the query log, extract query, (transform the query if needed) and store the response in an Elasticsearch index5.
For analysing and visualising data, Kibana is our tool of choice.
Deep replay
Our Machine Learning (ML) engineers are working on a recommender system, but in order to build a better model, they would like to use search data.
Here, however, there’s a tricky requirement: it needs to get at least the top 100,000 hits (no, that’s not an error).
It would be absurd to run such a workload in the production Elasticsearch clusters, because the cluster would quickly crawl to a halt (this is because queries become more expensive the more hits they need – and 100k is a hefty number).
To support such a use case, we can leverage the query log.
Every minute, we take a sample of recent queries from the query log (~1 minute old), replay those queries into a dedicated offline Elasticsearch cluster that has the same data as our production cluster (thanks to Kafka Connect), and record responses hit by hit into a topic on Kafka for further analysis.
On a side note: to reach those "deep" search hits in a consistent state, we use a combination of two Elasticsearch features: search_after and Point-in-time (PIT) API.
Speculative experiments
By speculative we mean that we run Elasticsearch queries that are similar (i.e. transformed) to the ones we collected from production traffic, and compare the results.
For example, in some rare cases when we want to change some aspect of the search query and we are not sure what impact it will have (e.g. on relevancy ranking), we use the query log in this way:
- Take some query log entries
- Run queries to the Elasticsearch cluster that has the production data
-
Using the hits from (2), construct a request to the Ranking evaluation API for every query transformation:
- hits from (2) are treated as relevant and go under
ratings - some
id - transformed query from (1) is put under the
request
- hits from (2) are treated as relevant and go under
Ask Elasticsearch Ranking evaluation API to measure the Precision at K.
So say that we change our filters in some way, and that should not affect the ranking, then we expect the “precision” to be 1.Or if we expect some impact on the ranking, then the “precision” should be lower than 1.
Future Work
Connect the Query Log with the Elasticsearch Rally for more accurate performance measurements.
Wrapping Up
The resulting implementation of the Elasticsearch query logging was well worth the development effort.
Having search queries recorded in Elasticsearch allows easy visualisation and analysis of query traffic, and since the query log is queryable, we can work only with an interesting portion of the log’s entries.
As we go on our journey of scaling search at Vinted, we expect to find even more use cases of the query log.
Footnotes
-
Confluent Kafka REST Proxy was used because it was already there and it allowed
srouterto avoid including the full-blown Kafka client dependencies. ↩ -
Kafka Connect was used because it was already used as described here. ↩
-
And if the cluster is not performing well in the first place, you don't want to do that. A good thing is that the Slow Log settings are dynamic, and you can turn it off completely. ↩
-
ketwill have its blog post, stay tuned. ↩ -
Yes, sometimes a query log replay involves 3 separate Elasticsearch clusters. ↩


Top comments (0)