Deciding which JavaScript charting library to include in your Vue.js application can be challenging due to the number of data visualization options out on the web.
ZingChart stands out by having over 100 unique events and methods to control, modify, and interact with Vue. The library not only includes over 35 unique chart types, but also has enough customization that you can create your own visualizations! If that's not enough, ZingChart recently released their official Vue.js component that wraps all of the library's functionality to be used easily in a Vue Application.
https://github.com/zingchart/zingchart-vue
Let's see how it works…
Creating a chart
A Hello World
A simple example of creating a chart using the zingchart-vue component is the best way to demonstrate the ease of the library.
<zingchart :data="{type: 'line', legend: {}, series: [{values: [4,5,3,3,3,4,5]}}"></zingchart>
The component takes a data configuration object specified by ZingChart to describe the features and values that a chart should take. The above example describes a line chart with some values to be plotted, along with a legend.
A More Advanced Example
The above example is a simple demonstration of how easy it is to create a line chart, but if we wanted something more complex and customized, the library and component allow us to do so:
Data Reactivity
The Vue component automatically updates whenever any of its attributes change. This includes series values, or anything in the configuration object.

https://glitch.com/~zingchart-vue-reactivity
Interactivity with other components
We can integrate our charts to other charts or UI components by listening to events, and modifying the chart using methods.
Binding Events
For example, if we wanted to display a node's value on hover in our Vue application, we would hook into the node_mouseover event.

https://glitch.com/~zingchart-vue-events
All events that ZingChart emits are available on the Vue component with the "@" annotation.
Modifying with methods
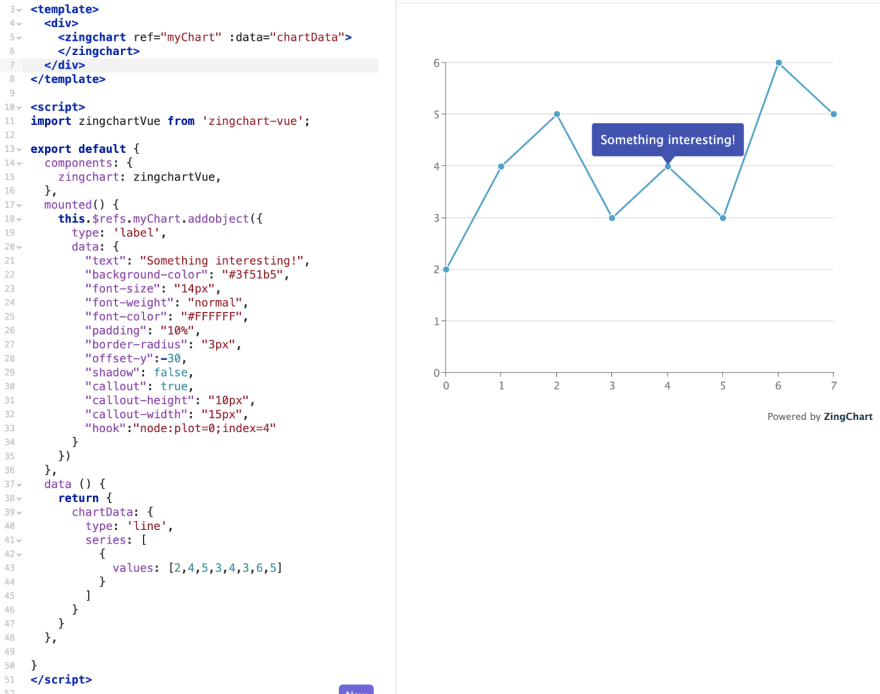
Alternatively, if we wanted to annotate our chart by adding a label to a specific node, we would utilize the addobject API method and create a new label:
this.$refs.myChart.addobject({
  type: 'label',
  data: {
    "text": "Something interesting!",
    "background-color": "#3f51b5",
    "font-size": "14px",
    "font-weight": "normal",
    "font-color": "#FFFFFF",
    "padding": "10%",
    "border-radius": "3px",
    "offset-y":-30,
    "shadow": false,
    "callout": true,
    "callout-height": "10px",
    "callout-width": "15px",
    "hook":"node:plot=0;index=4"
  }
});

https://glitch.com/~zingchart-vue-methods
All methods are readily available on the component's object to be called.
Get Charting!
With a better understanding of ZingChart and its Vue component, all you need is to include it into your application. Head over to our Github repository for the full documentation of the component: https://github.com/zingchart/zingchart-vue
Stay Tuned
Over the coming weeks we will be creating a dashboard built with Vue and the zingchart-vue component to demonstrate the flexibility and power of both tools. To receive updates of when we publish new articles, follow us on twitter:


Top comments (0)