Recently, I had posted about application observability with Grafana and Loki. The set up discussed in the previous post enables Kubernetes administrators and application support teams to troubleshoot application issues through log inspection.
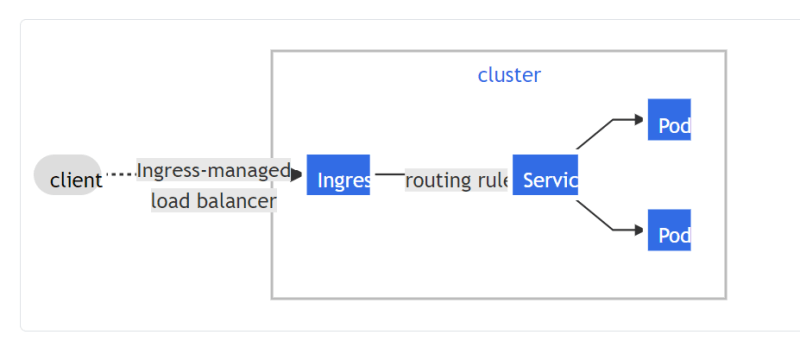
Today, I'll continue the discussion of the topics by introducing ingress tracing. Kubernetes resources are accessed from outside the Kubernetes cluster using an Ingress. An Ingress proxies inbound requests into Kubernetes and routes the requests to internal Kubernetes resources (i.e. Services and Pods). Ingresses are managed using an ingress controller which provides a proxy interface, a set of cluster-resource-definitions (usually in the form of specialized annotations which are attached to the Ingress resource), and a web-hook which responds to ingress requests.
Using ingress-nginx and Jaeger traffic in the ingress network can be monitored in the form of traces. The example discussed with use ingress-nginx and Jager on top of the Linkerd service mesh.
Setting Up Linkerd
Since Jaeger and ingress-nginx will rely on Linkerd to stream metrics from nginx to Jager, Linkerd will have to be set up first.
Create a file, config.yaml, which will be used to customize the Linkerd install.
tracing:
  enabled: true
Install Linkerd using the command:
linkerd install --config config.yaml | kubectl apply -f -
If you have an existing installation of Linkerd, the Linkerd installation can be updated using the linkerd upgrade command:
linkerd upgrade --config config.yaml | kubectl apply -f -
Once Linkerd is updated or fully initialized, ingress-nginx will need to be updated or deployed. Jaeger is deployed as part of the linkerd deployment.
Ingress-Nginx Helm Deployment
The easiest way to deploy ingress-nginx is by utilizing the helm chart. Create a file, values.yml which will contain customization values for the helm install. ingress-nginx will need to be configured to stream traces to Jaeger.
controller:
  config:
    enable-opentracing: "true"
    zipkin-collector-hosts: linkerd-collector.linkerd:55678
  podAnnotations:
    linkerd.io/inject: enabled
    config.linkerd.io/trace-collector: linkerd-collector.linkerd:55678
    config.alpha.linkerd.io/trace-collector-service-account: linkerd-collector
Deploy the ingress-nginx helm chart with the following:
# Update your helm repos with the ingress-nginx repo
helm repo add ingress-nginx https://kubernetes.github.io/ingress-nginx
helm repo update

# Install the ingress-nginx chart
helm install ingress-nginx ingress-nginx/ingress-nginx --namespace=ingress-nginx --values=values.yaml
Upgrading an Existing ingress-nginx configuration
An existing installation of ingress-nginx can be updated to trace to Jaeger in a manner similar to the Helm Deployment mentioned earlier.
kubectl edit -n ingress-nginx configmap ingress-nginx-controller
Update the data section with the following yaml body
data:
    enable-opentracing: "true"
    zipkin-collector-hosts: linkerd-collector.linkerd:55678
Update the ingress-nginx-controller deployment with the following pod annotations
kubectl edit -n ingress-nginx deployment ingress-nginx-controller
spec:
  template:
    metadata:
      annotations:
        linkerd.io/inject: enabled
        config.linkerd.io/trace-collector: linkerd-collector.linkerd:55678
        config.alpha.linkerd.io/trace-collector-service-account: linkerd-collector
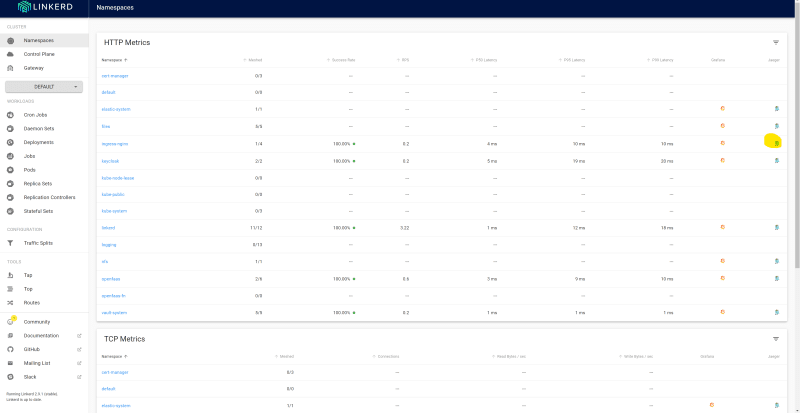
Once the ingress-controller is re-deployed, traces will be visible on Jaeger


Top comments (0)